Everyone benchmarks models. Almost nobody benchmarks the machinery that sits between the model and the work: the agent harness. That machinery decides how fast tool calls fan out, how much of your context window survives, and how much each task costs. We built Orca Harness, a small Rust execution kernel, to make that layer measurable and boring. It now drives two very different hosts: the Orcacode terminal CLI and Marlin, the sandboxed runtime on the Orca platform. This is a tour of the design and the numbers.
- Agent harness
- Everything around the model that turns text generation into work: prompt assembly, the loop, tool dispatch, context bookkeeping, cancellation, limits, and retries.
- Agent loop
- Call the model, read its decision, execute the tools it asked for, feed results back into context, repeat until the task completes.
- Host
- The program that embeds the harness and gives it a life: a terminal UI, a headless CLI, or a per-session worker inside a platform.
The harness is a first-class performance variable.
Composio's August 2026 comparison made this concrete: the same model, driven through eight different harnesses on 25 identical tasks, produced pass rates from 68% to 88%. Same weights, twenty points of spread. The difference was entirely in the machinery: what tools each harness exposes, how it truncates output, how it schedules calls, how it phrases the system prompt.
The same comparison ranked Oh My Pi first overall on pass rate and found that Pi had the fastest median runtime, the fewest tokens, and the fewest tool calls of the eight. That matters later in this article: when we benchmark our own harness live, the baselines we pair against include both, precisely because a public third-party evaluation identified one as the correctness leader and the other as the efficiency frontier. Beating a weak baseline proves nothing.
A harness earns its keep on three axes. Latency it adds between a model emitting tool calls and those tools doing useful work. Tokens it spends on schemas, transcripts, and re-reads. Failure modes it removes: cancellation that kills spawned children, results that come back in a deterministic order, writes that cannot clobber files the model never read. All three are engineering properties, which means all three can be measured and budgeted in CI.
The loop is sacred. Everything around it is extensible.
Orca Harness is organized like an operating system: a privileged kernel kept deliberately tiny, and everything else attached through a typed extension interface. The kernel owns exactly the things that must be correct for every agent ever written; the surrounding system owns the things that differ per deployment.
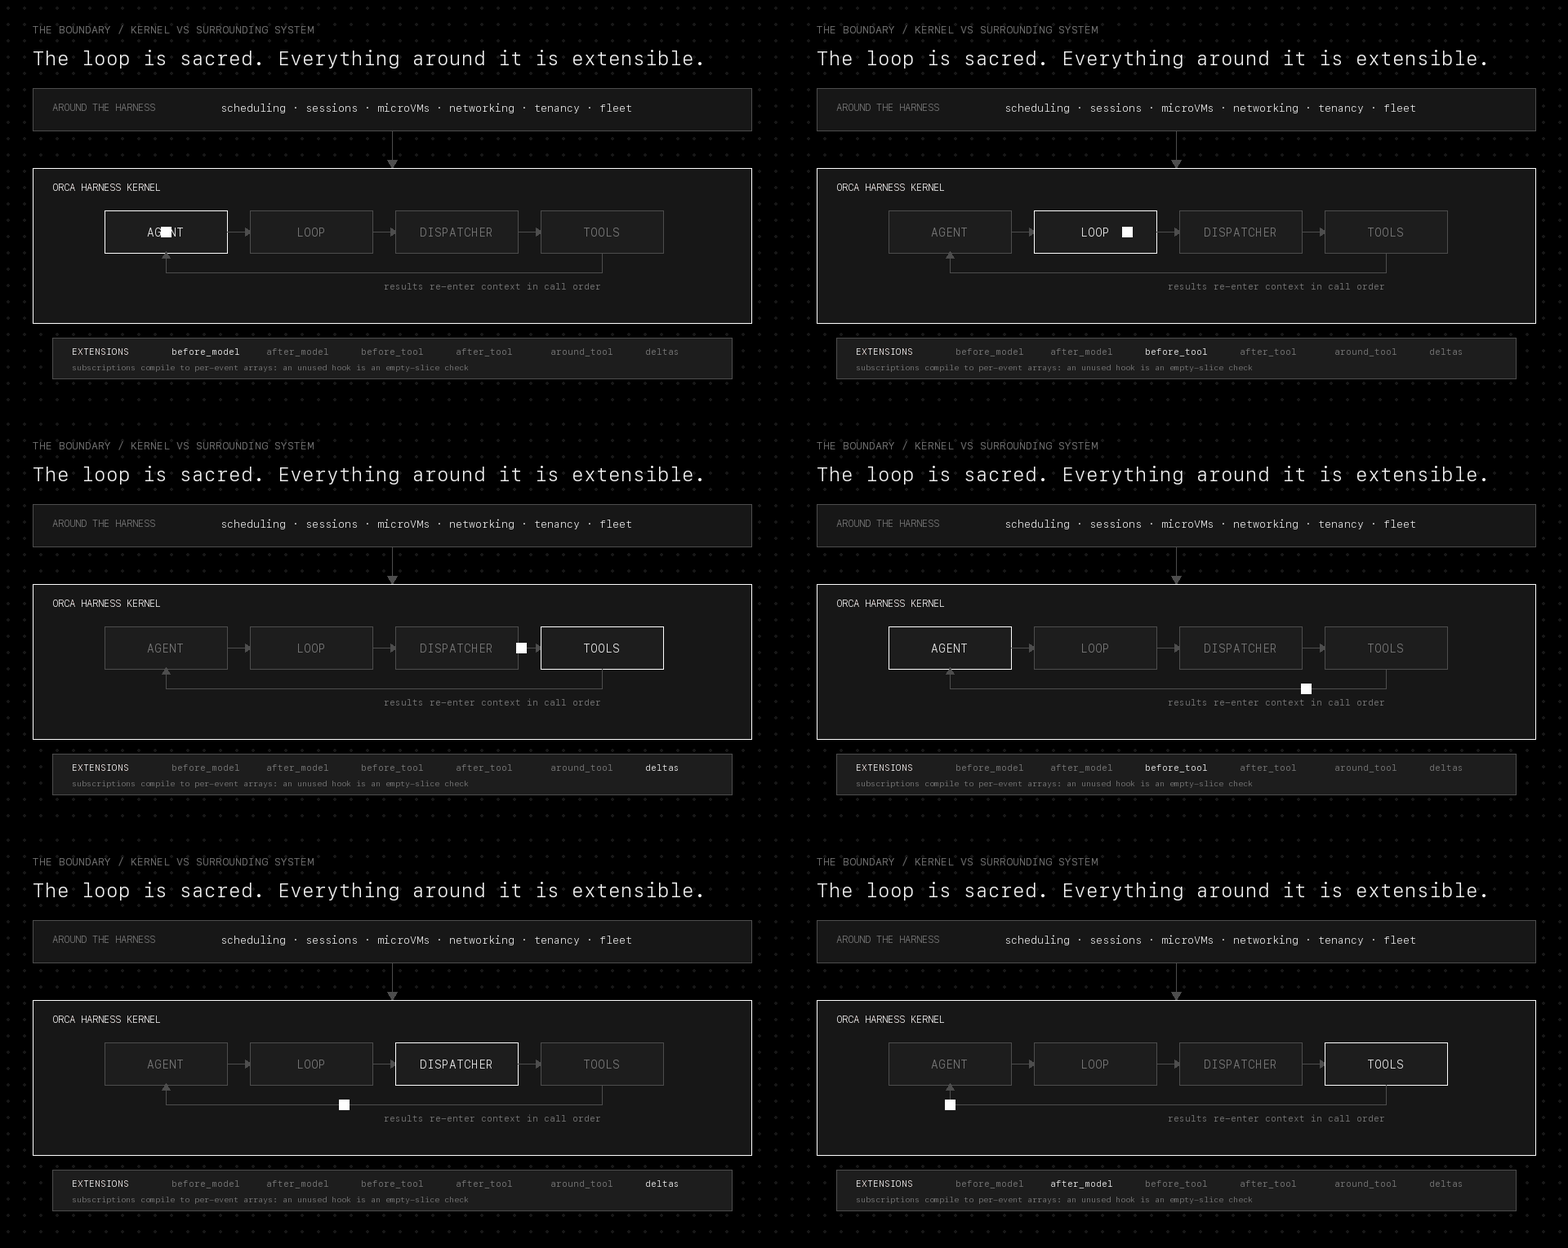
The kernel is a standalone Cargo workspace: harness-core holds the loop, dispatcher, and contracts; model-providers holds OpenAI-compatible, OpenRouter, and Codex adapters; tools holds shell, process, file, search, and persistent Python/Bun compute tools; extensions holds events, policy, truncation, retry, usage, and memory. Nothing in Orca's Go control plane depends on it, and it depends on nothing there. Building an agent on it is deliberately dull:
use orca_harness_core::Agent;
use orca_harness_model_providers::openai::OpenAiModel;
use orca_harness_tools::{core_tools, Workspace};


let model = OpenAiModel::new("gpt-4o")
    .api_key(std::env::var("OPENAI_API_KEY")?);


let ws = Workspace::current_dir()?;
let mut agent = Agent::new(model);
for tool in core_tools(&ws) {   // shell, files, search, compute
    agent = agent.tool_arc(tool);
}


let result = agent.run("Fix the failing test").await?;
Deliberately not in the kernel: durable sessions, workflow DAGs, queues, planners, built-in memory, UI. Those belong to extensions or hosts. Keeping them out is what makes the performance numbers below possible to defend, because the hot path has almost nothing on it.
Concurrency is a kernel property, not a tool trick.
When a model emits several tool calls in one turn, the harness has a scheduling decision to make, and the correct answer differs per call. Reading two files concurrently is free. Two writes to the same file must not interleave. A destructive migration should run alone. Orca Harness makes the tool itself classify each call:
// The tool classifies each call from its input.
fn concurrency(&self, input: &Value) -> Concurrency {
    match self.kind {
        ReadFile | Grep | Glob => Concurrency::Parallel,
        WriteFile | EditFile   => Concurrency::Keyed(path_of(input)),
        Migration              => Concurrency::Serial,
    }
}
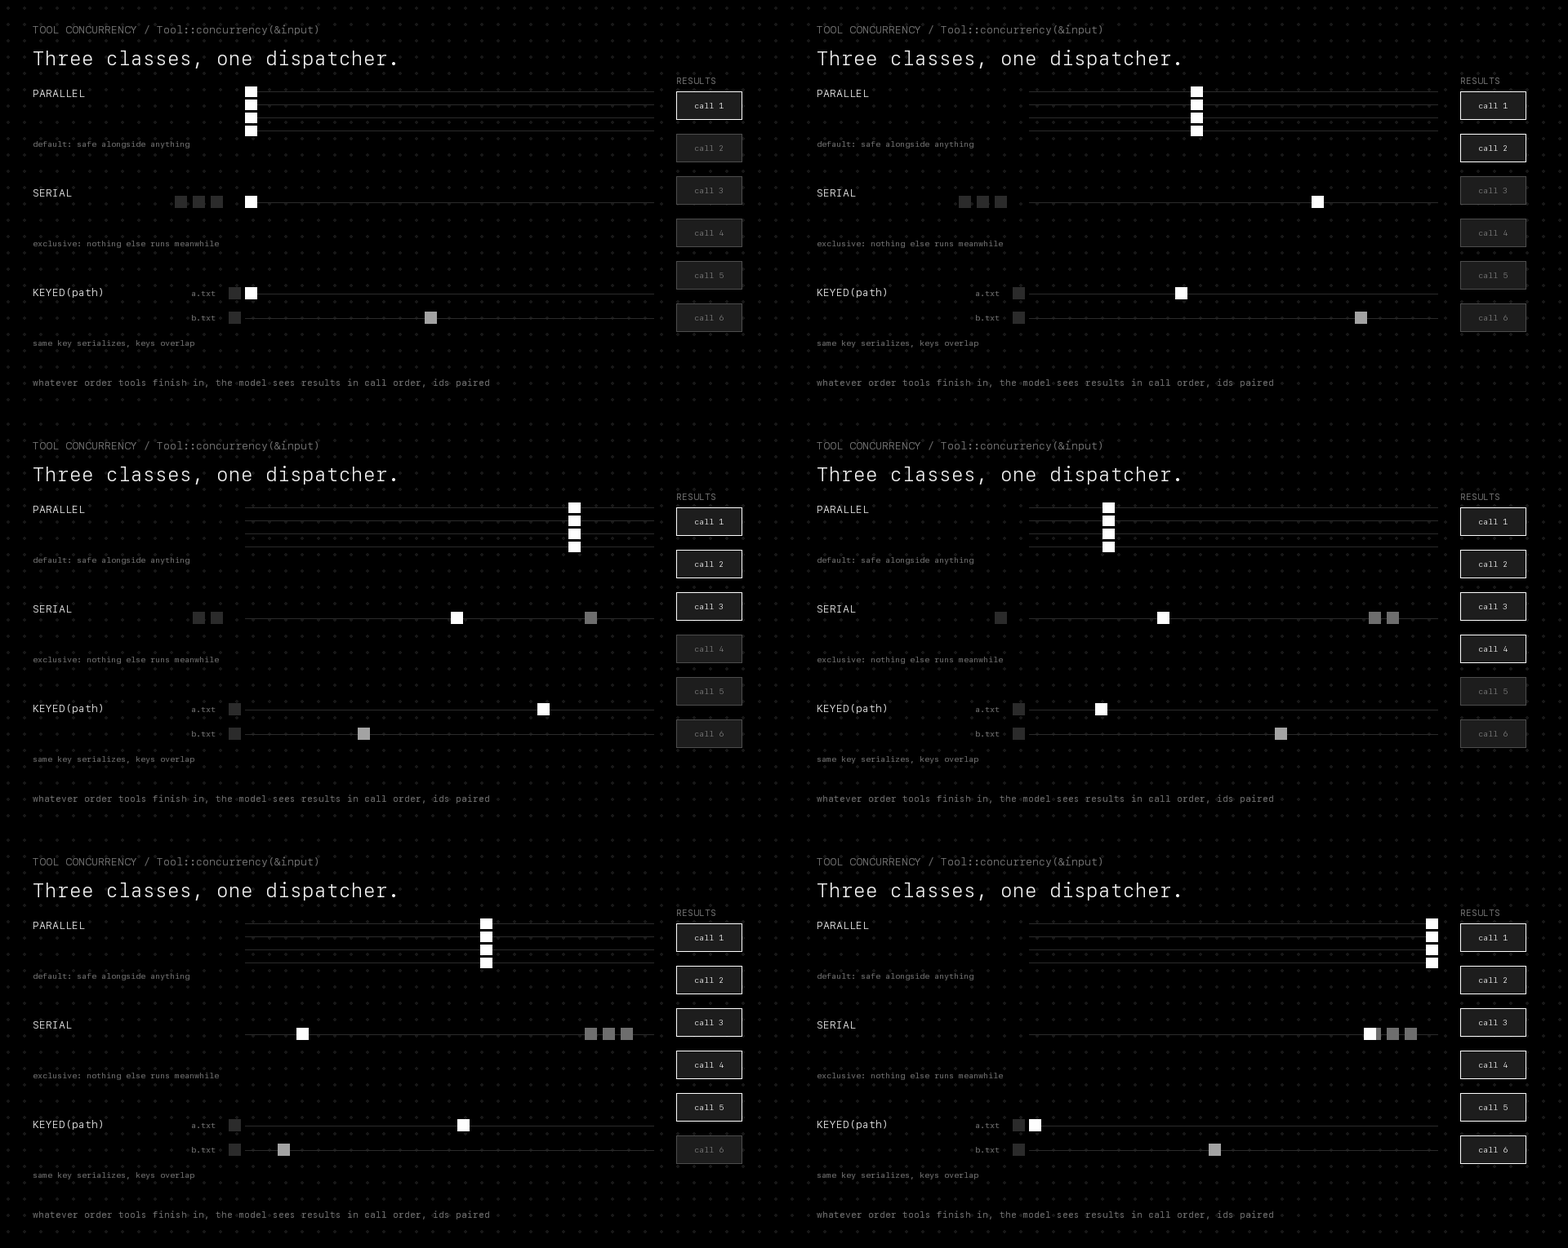
Parallel is the default. Serial is exclusive: nothing else executes while it does. Keyed is the interesting one: calls sharing a key serialize in call order while unrelated calls continue concurrently, which is exactly the semantics you want for file writes keyed by target path. Whatever order tools finish in, the model always sees results in the original call order with call ids paired, because a chat-completions endpoint rejects anything else and a nondeterministic transcript is undebuggable.
One more file-safety invariant lives at this layer. write_file replaces a file wholesale, so a model that has not seen the current contents is not overwriting a file, it is deleting one and writing another. A shared guard refuses the write until the file has been read through the harness, and refuses again if the file changed on disk after that read. Creates pass, since a create needs no prior read.
Unused extensibility costs an empty-slice check.
Everything outside the loop composes through an Extension trait with hooks around the model call and each tool call, plus a delta stream for incremental output. The performance trick is at construction: subscriptions compile into per-event arrays, so a hook site with no subscribers is a check against an empty slice, not a dynamic dispatch over every registered extension. Registering an extension that only cares about after_tool adds zero work to before_model.
EventStream -> typed HarnessEvent union, serialized as NDJSON:
  assistant_delta | reasoning_delta | assistant
  tool_call | tool_result | usage | result | error


Truncation -> caps oversized tool output; the model pages the
  full result back through read_tool_result
ToolRetry / RetryModel -> retries tool failures and transient
  model errors, mirrored into subagents at every depth
ToolPolicy -> allow/deny before execution (allowlists, plan mode)
UsageMeter -> accumulated self-reported token usage per run
EventStream is how hosts are built. Orcacode's TUI, its headless --json mode, and Marlin's platform protocol are all consumers of the same typed event union; none of them reach into the loop. Truncation deserves a note because it quietly protects both budgets at once: oversized tool output is capped before it hits the context window, but the full result stays addressable, so the model can page back through it instead of re-running the tool.
The metric that matters is not startup. It is dispatch.
The harness's job is to add as little as possible between a model emitting tool calls and those tools doing useful work. So the regression-gated benchmark measures exactly that interval with no-op tools: T0 is dispatch entry, T1 is the first tool body starting, T2 is the last tool body starting. With no-op tools, everything between T0 and T2 is pure harness overhead.
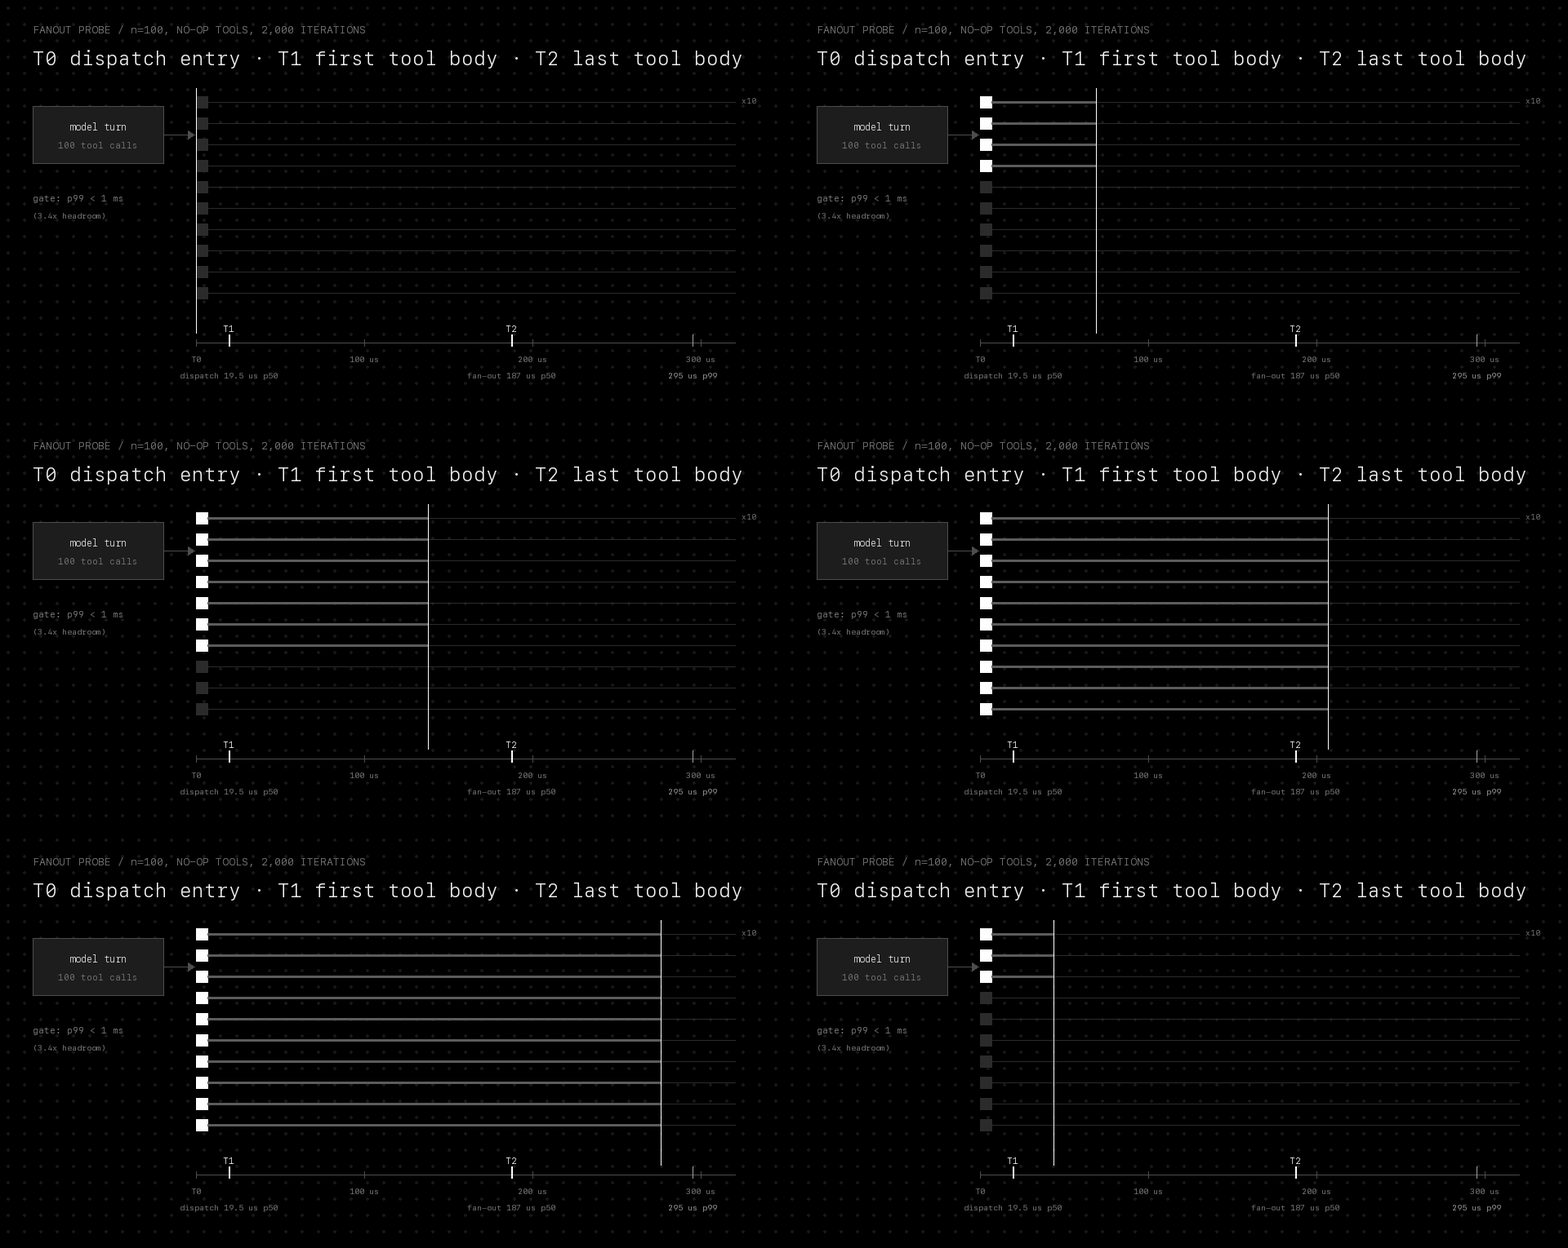
A single call dispatches in about a microsecond because it never leaves the dispatching task: one unit of every batch runs inline after the rest are spawned, so a 1-call batch is function-call overhead, not a cross-thread handoff. Synchronization is elided when it cannot constrain the batch: the parallelism semaphore only exists when the batch exceeds max_parallel_tools, and the Serial-exclusivity lock only exists when the batch actually contains a Serial call. Tasks address the batch through one shared Arc<[ToolCall]> and each input is moved, never cloned. The residual ~20 µs before the first spawned body starts is tokio waking a parked worker thread, which shrinks on a busy server with hot workers.
The harness turns sum(latencies) into max(latency).
Microsecond dispatch is a means, not an end. The end is what happens when the tools are real: filesystem writes, subprocesses, network calls. A second probe drives the actual write_file, read_file, and shell tools through the real dispatcher, so harness overhead is measured against genuine tool latency.
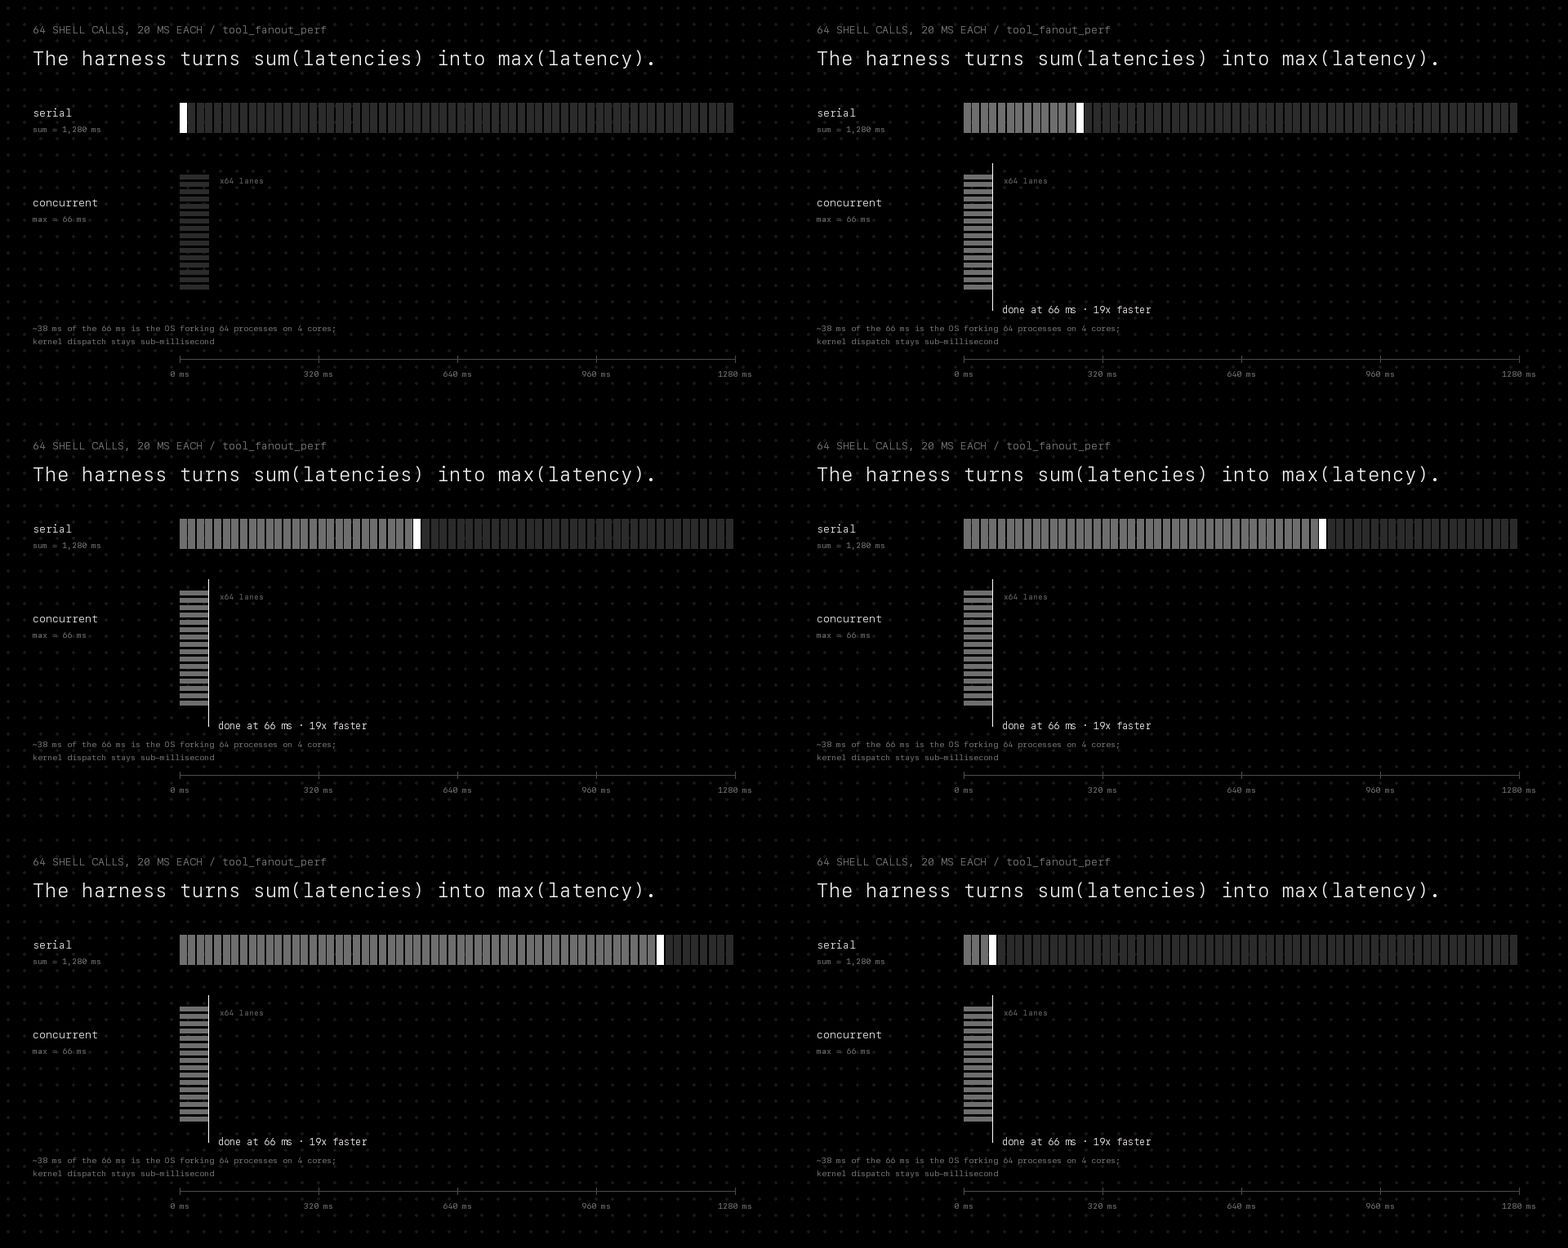
The shell case is the headline because it is the latency-bound one. For CPU-cheap, latency-heavy tools, which is what subprocesses, HTTP calls, and remote MCP tools all are, a harness with real concurrency changes the cost of a model turn from the sum of its tool latencies to the maximum of them. That is the whole argument for building concurrency into the kernel instead of bolting it onto individual tools: the model can fan out 64 investigations in one turn and pay for one.
Cold start is a host concern. We measure it so it cannot grow.
Startup does not gate the loop, but a CLI that takes a second to appear is a CLI you stop reaching for, and platform runtimes that spawn a worker per session pay the cold start on every spawn. The suite benchmarks the orcacode binary with hyperfine against a private fixture HOME, so results do not depend on what the developer happens to have installed. ORCA_BENCH=1 makes the binary exit right after the agent is built and just before the terminal is claimed: the entire cold-start path, no model call, no TTY.
Scanning a workspace with 64 skills adds about 2 ms; resuming a 2,000-message transcript adds about 3 ms. Two fixture rules keep these numbers honest: the resume fixture is never written (its transcripts end on complete triplets, so resume opens for append instead of rewriting), and the session-creating benchmark gets its own workspace that hyperfine wipes between runs, never the directory the resume benchmark reads.
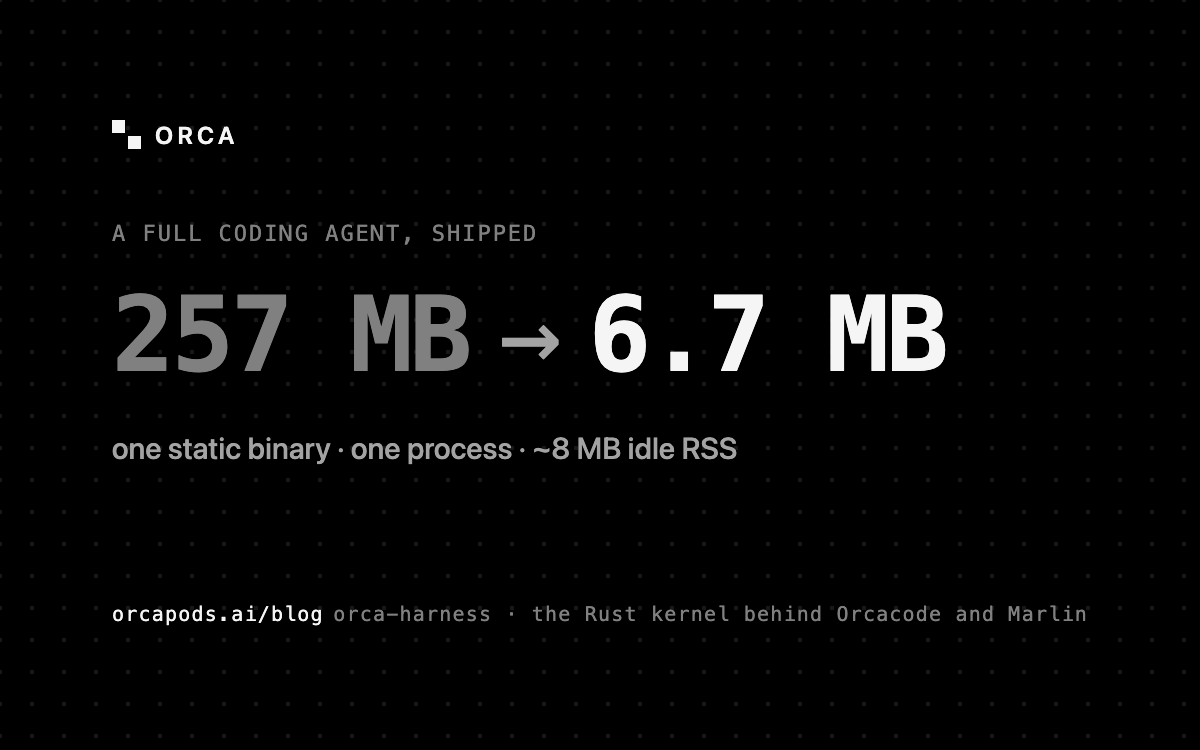
The footprint numbers explain the startup numbers. A pure-Rust kernel ships as one static binary with no bundled JavaScript runtime and no wrapper processes, which puts it an order of magnitude below the product CLIs on both axes:
The point is not bragging rights on ls -la. An 8 MB resident harness is cheap enough to embed as a system's execution primitive and to run many agents per host, which is exactly how the Orca platform uses it.
Same model, same tasks, four harnesses.
Microbenchmarks prove the kernel is thin. They do not prove the harness helps a model finish work. For that we run a scripted live suite: 16 tasks over a synthetic project fixture (targeted retrieval, cross-file comparison, log diagnosis, schema diffs, graph reasoning, and two real code edits with validators), three repetitions each, every harness driven headless on the same model slug, anthropic/claude-haiku-4.5 through OpenRouter, with the same prompts, fixture copy, 45 s timeout, and step ceiling. No shell, web, MCP, or subagent tools; fresh ephemeral workspace per attempt; order alternated between harnesses; raw NDJSON streams timestamped by the parent process so nothing trusts provider clocks.
The baselines come straight from Composio's eight-harness comparison: Oh My Pi, its top-ranked harness on pass rate, and Pi, its efficiency leader, plus Claude Code, the most widely deployed coding harness. All are routed through the same OpenRouter endpoint and key as Orcacode so the model is held constant.
Correctness lands in a band: Oh My Pi 44/48, Orcacode 43/48, Pi 41/48. Getting there is where the harnesses separate. Orcacode finishes the workload with the fastest median wall time, roughly half the tokens of either Pi variant, and the lowest normalized cost; Oh My Pi buys its one extra correct answer at 2.1x Orcacode's spend and the second-slowest wall time. Claude Code, pushed through a gateway and a stripped bare mode rather than its native stack, burns turns re-reading, spends 2.07 M tokens, and times out on six attempts; treat its column as what happens to a heavyweight harness outside its home environment, not as a verdict on the product. Against Pi, the paired numbers from the same run:
Why does a thin harness win on tokens? Because most of a harness's token bill is machinery the model has to read: tool schemas, transcript framing, truncation slop, and repeated context. A kernel that ships a small core toolset, caps tool output with pageable truncation, and adds nothing else to the conversation simply gives the model less to re-read every turn. The 42% cost reduction against Pi is mostly that, compounded over every turn of every task.
131,072 concurrent subagents, zero dropped calls.
Subagents are tools like any other in this kernel: a subagent call spawns a child agent whose own tool calls run through the same dispatcher, with retry policy and plan-mode restrictions mirrored to every depth. To find the bookkeeping limits, a stress suite drives the kernel with a fake instant model and fake workers, so what is measured is purely the harness's ability to track in-flight work.
The largest fully observed fan-out held 131,072 concurrently active workers in one process. Across the suite, 1,444,844 calls completed with zero failures (a two-sided 95% Wilson upper bound of 2.7 per million on the failure rate), and median throughput at that widest fan-out was about 170,000 calls per second. Real deployments are bounded by models, sandboxes, and money long before the kernel; the point of the number is that the scheduler is not the ceiling.
One kernel, two hosts: a terminal and a fleet.
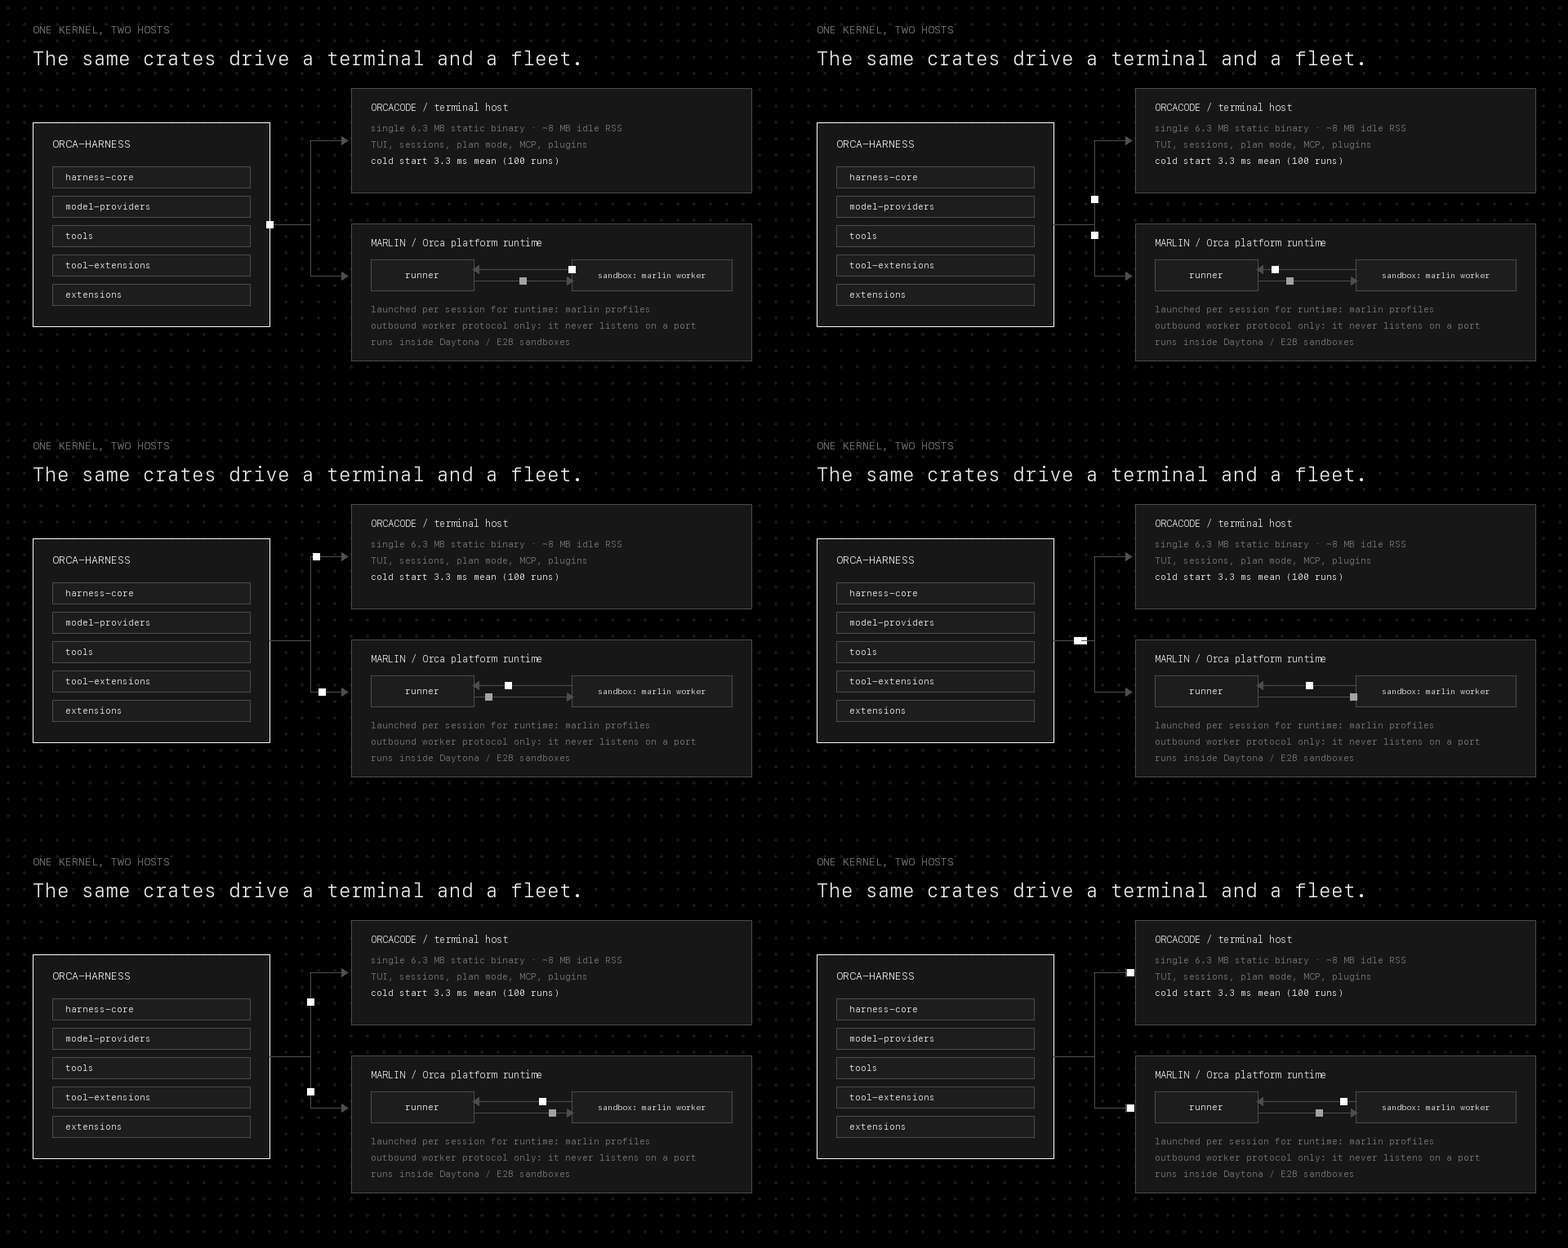
Orcacode is the reference host: proof the kernel drives a real terminal agent. It layers sessions (append-only JSONL with resume, rewind on user-turn boundaries, and forking), approval gates with workspace-scoped grants, plan mode as a tool allowlist enforced on every call rather than at agent build, MCP with searchable deferred schemas, and an Agent Plugins client, all as host code and extensions. None of it touched the loop.
Marlin is the same kernel worn by the Orca platform. A profile with runtime: marlin gets a dedicated worker launched per session inside a Daytona or E2B sandbox. Unlike Orca's shared Node sidecars, Marlin never listens on a port: it calls back to the runner through an authenticated outbound worker protocol, so the sandbox needs no inbound networking at all, and the 3 ms cold start means spawn-per-session costs effectively nothing. The harness properties this article measured are exactly the properties the platform inherits: per-session isolation priced in single-digit megabytes, deterministic transcripts, and tool fan-out that is never the bottleneck.
That is the argument for treating the harness as an engineering artifact rather than an accident of whichever SDK you started with. The loop is generic machinery; keep it tiny, measure it, gate it in CI. Everything your product actually is, the UI, the platform, the policy, composes around it. The harness should be the most boring, most measured code you run, because every agent you ever ship runs inside it.